
By Admin on 18 July 2022
This post is heavily dependent on the previous blog post in this series so you can always go back and check it out if you are feeling a little lost with the Fluent Bit aspect of the configuration. We are going to modify all configuration files except log generator service from ./service.yml. Just like the last time, you can find configuration files on GitHub. Now you should be ready for the rest of the blog.
To visualize logs first we need to store historic values somewhere. We opted for Elasticsearch as we have experience with it and it has served us well for years. This means that along with Fluent Bit service that collects logs, we now also need an Elasticsearch instance. Let’s start by creating logging.yml with both of these configurations
./logging.ymlversion: '2.3'
services:
elasticsearch:
image: elasticsearch:7.8.0
ports:
- "9200:9200"
environment:
ES_JAVA_OPTS: "-Xms1g -Xmx1g"
discovery.type: "single-node"
volumes:
- elasticsearch-data:/usr/share/elasticsearch/data
fluentbit:
image: fluent/fluent-bit:1.4.6
command: "/fluent-bit/bin/fluent-bit -c /configs/config.conf"
ports:
- "24224:24224/tcp"
- "24224:24224/udp"
volumes:
- ./config.conf:/configs/config.conf
- ./parsers.conf:/configs/parsers.conf
volumes:
elasticsearch-data:
Code language: JavaScript (javascript)Note. You can easily add Kibana or Grafana to the above setup by adding
  kibana:
        image: kibana:7.8.0
        ports:
            - "5601:5601"Code language: CSS (css)
Kibana will automatically connect to your Elasticsearch instance, but in order to view logs you will need to create a new index pattern with settings
| Index pattern settings | |
|---|---|
| Index pattern | logs-* |
| Time Filter field name | @timestamp |
Table 1. Kibana Elasticsearch index pattern settings
or
    grafana:
        image: grafana/grafana:6.5.2
        ports:
            - "3000:3000"
        volumes:
            - grafana-data:/usr/share/elasticsearch/dataCode language: JavaScript (javascript)
somewhere in the services section, along with updating the volumes section to
volumes:
    elasticsearch-data:
    grafana-data:
in order to preserve Grafana configuration and user data. Note that Kibana uses the Elasticsearch instance for saving its configuration which is why this step is not needed for Kibana.
To connect Grafana to Elasticsearch, you simply need to add a new data source and fill in:
| Data Source settings | |
|---|---|
| URL | http://elasticsearch:9200 |
| Pattern | daily |
| Index name | [logs-]YYYY.MM.DD |
| Time field name | @timestamp |
| Version | 7.0+ |
After this, press the Save & Test button and you are ready to go!
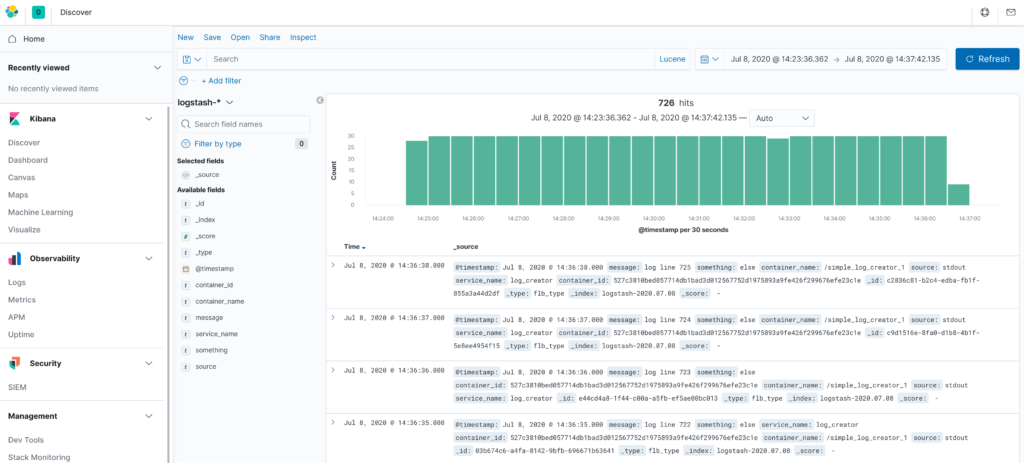
Kibana is a free and open user interface that lets you visualize your Elasticsearch data and navigate the Elastic Stack. It integrates seamlessly with Elasticsearch and provides an excellent experience for exploring both logs and various metrics extracted from logs. Elastic also offers the X-Pack license to provide even more capabilities. One example would be alerting, which does not come together with Elastic without X-Pack.
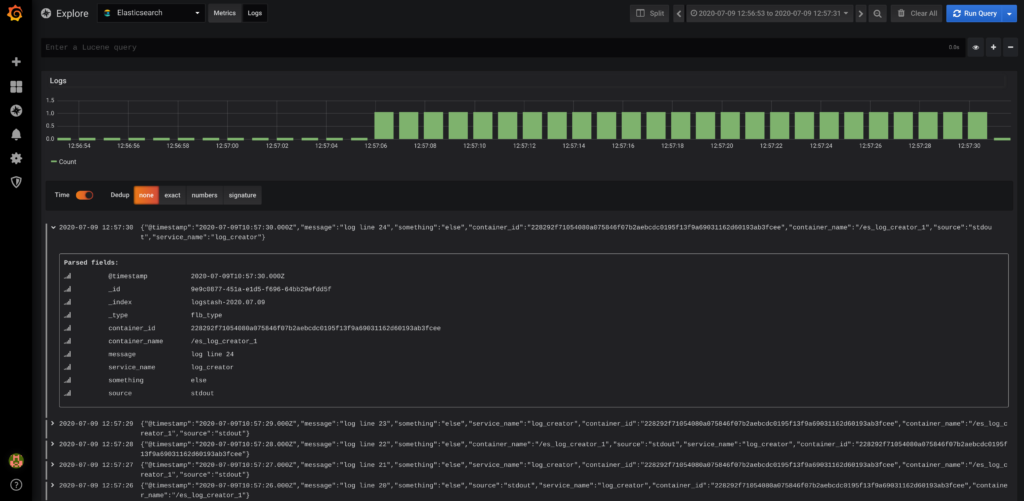
Grafana is in general more oriented towards metrics than the logs. Even though you can inspect logs and stack traces, the experience you get from Kibana is simply superior. The most important advantage Grafana has over Kibana is that even the free version of Grafana allows you to query, visualize, alert on and understand your metrics no matter where they are stored. This opens up a lot of possibilities. For example, we used Grafana together with InfluxDB to build a historical overview of official Covid19-related data for Croatia. You can see the board in action over at https://covid19hr.velebit.ai
Still can’t choose? Use both of them. That is exactly what we at Velebit AI do as well! We prefer Grafana for metrics and alerting, while we use Kibana once something goes wrong and we need to delve into the application logs.
Finally, we must configure Fluent Bit to send the logs it collects to the Elasticsearch. We can do this by simply adding another OUTPUT section at the end of the config.conf file from the previous blog post.
# send logs to elasticsearch
[OUTPUT]
    Name es
    Match *
    Host elasticsearch
    Port 9200
    Logstash_Format On
    Logstash_Prefix logs
    Generate_ID OnCode language: CSS (css)
This would make the final file look like this
./config.conf[SERVICE]
# import parsers defined in a parsers file
Parsers_File /configs/parsers.conf
# collect docker logs using fluend logging driver
[INPUT]
Name forward
Listen 0.0.0.0
port 24224
# make SERVICE_NAME key lowercase
[FILTER]
Name modify
Match *
Rename SERVICE_NAME service_name
# try parsing log as json and lift its keys to the first-level
[FILTER]
Name parser
Match *
Parser json
Key_Name log
Reserve_Data On
# send logs to stdout
[OUTPUT]
Name stdout
Match *
# send logs to elasticsearch
[OUTPUT]
Name es
Match *
Host elasticsearch
Port 9200
Logstash_Format On
Logstash_Prefix logs
Generate_ID OnCode language: PHP (php)After modifying all the necessary files, we can start the defined services using
docker-compose -f logging.yml up -d
docker-compose -f service.yml up -dCode language: CSS (css)
An easy way to check whether the setup is working or not is to make an HTTP request directly to Elasticsearch, for example
curl http://localhost:9200/logs-$(date +'%Y.%m.%d')/_search\?pretty<strong>=</strong>trueCode language: HTML, XML (xml)which should return a list of entries in the specified index. This means you are ready to go and explore your logs in Grafana and Kibana!
In this blog post we used logs created by dummy log-generating service defined in ./service.yml file. In production environments you will have to collect logs from various sources and you can do that easily as long as Fluent Bit can parse their logs. We decided to use JSON log format for everything as it simplifies a lot of things. If you want to learn more about this you can check out our previous blog posts where we discuss how we solved the problems with formating uwsgi and Python logs as JSON.
Finally, complete cleanup can be executed using
docker-compose -f service.yml down --volumes
docker-compose -f logging.yml downCode language: CSS (css)Partner with us to develop an AI solution specifically tailored to your business.
Contact us